|
Service providers critically rely on advanced TV middleware solutions to achieve carrier-grade performance and scalability for their on-demand TV services. They must balance their requirement for high performance, reliability and scalability against their need for cost-effective solutions. With a solution matching their requirements, they can confidently differentiate their brand and build their customer base in the hyper-competitive, on-demand TV services market.
Based on the analysis, it's important that a platform must have service delivery capability with high performance, service continuity and scalability at a fraction of the cost of many middleware suppliers.
To validate the performance and capability of an IPTV system, |
Espial performed simulated load testing on it's Evo TV service platform. These test results show the importance of testing for mixed types of loading conditions including video on demand and other types of service requests. The performance results showed the types of latency and CPU capacity that occurred during loaded conditions.
Testing Methodology
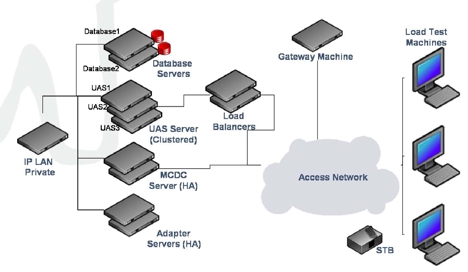
Figure 1 demonstrates the test configuration that Espial used to test the analysis. In this setup, a redundant, clustered Evo TV Service Platform |
|
system runs over a IP network in the Espial Innovation Laboratory. This topology was used to conduct scalability testing (include load testing and stress/duration testing) by simulating subscriber requests from Set Top Boxes (STBs).
The test was carried out with Load Test Machines, which is a hosting a load generation tool to simulate subscriber a set of real-world VOD, PPV and IPTV requests. The tool simulates hundreds of thousands of STB http requests per hour. One load test machine is configured as a management console - it monitors overall system performance and generates detailed reports. Espial also used a bulk load tool to pre-load the Evo Server database with large amounts of data. This allows performance and scalability to be measured across a wide range of IPTV deployments- from 50 to 5 million subscribers.
Tests were run simulating a 100K subscriber (STBs) and 500K subscriber (STBs) environments. By extrapolating the test results, the results projected the scaling and performance results up to 920K users.
Configuration Parameters
For the test, the key configuration parameters used during the performance and scalability testing were were: |
· 10 Service Domains with different channel line ups per region;
· 200 channels per subscriber;
· 100% of STB devices are generating background traffic;
· 5% (of the 10% VoD audience) request a VoD
bookmark/per hour;
· 10% of the subscriber base browse the VoD catalogue;
· 0.6% of the total VoD purchases were cancelled.
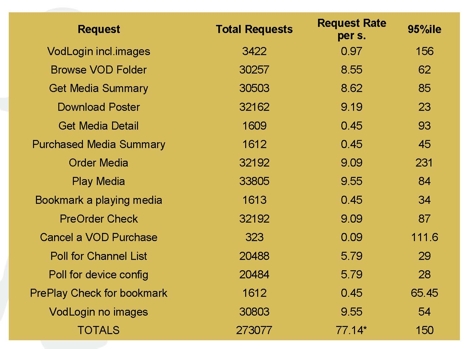
Figure 2 shows a chart with the key configuration parameters with their results.
Traffic Profile and Measurement
VOD Usage
Video on-demand is a lucrative service for operators. Their overall TV service performance critically affects their ability to generate revenue. Poorly performing middleware can undermine their business model.
For this test, a performance test system was modeled to realistically simulate 500,000 users with a 10% concurrency.
|
|
Other Simulated Client Traffic
To achieve a =real-world' traffic simulation, the following several activities were modeled. The device Configuration request for 500,000 accounts evenly distributed across a 24 polling interval and IPTV Channel list requests for 500,000 accounts wereevenly distributed across a 24 polling interval, both of which resulted in 20,834 requests/hr.
Five percent of all accounts issued a bookmark request and subsequent play resume requests at approximately 1637 requests per hour. Also, users who drilled into the Details page of a media before making the purchase made 5% of all purchases.
Activities with 1% of all purchases were subsequently cancelled, which translates to 328/hr, with all purchase activities preceding with 3 browse folder requests, or 30,764 requests/hr
All VOD sessions were initiated with VOD portal log-in requests (10% of which requested all associated images included in mainContainer.html, the remainder simulated STBs with the images in their cache). Additional VOD portal logins were made by users logging in to check account details (including previous item)
System Performance
The simulation also monitored other Evo TV Service Platform capabilities to ensure optimal performance. Billing and activity adapters were operating in production mode while tests were running (i.e., database traffic incurred).
The Multicast Data Carousel (MCDCC was running and downloading EPG data to client STBs. A STB was logged into the VOD Portal - response times were normal and the end user experience was high quality.
A Management UI session was also running and showed response time to user actions operating within specifications.
|
Performance Results
During the tests the following criteria were met:
· 99% of responses had a latency < 2 seconds
· All requests had < 2 second latency
· 98% of requests had < 1 sec latency
CPU and memory requirements performed within specification. The specification and actual performance is set so that a single node failure on any component does not result exceed CPU and memory capacity of the system. According to the results, system degradation would only impact service if a dual failure occurred in a single cluster.
VOD Usage
During the test, Espial also demonstrated VOD concurrency performance. This was demonstrated during a peak usage interval which lasted 90 minutes in the simulation. During this period, 49,091 accounts made a VOD purchase representing about 10% of the overall subscribers. This translates to a user concurrency of 0.2% or, in other words, the simultaneous support of 1,000 subscribers. The system allowed, at any single point in time during the 90 minute interval, 1,000 users to successfully purchase a VOD during their VOD portal visit.
Resource Utilization Results
Database Nodes
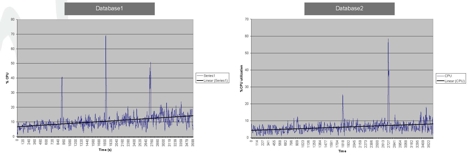
Figure 3 shows diagrams of the 2 database nodes. Statistics for CPU utilization, as depicted in the following table and diagrams, indicates that the 2 database nodes were consistently working at or below 10% CPU utilization during the testing. This indicates ample support for an n-1 sparing strategy for the database cluster for half a million subscribers
(STBs).
|
|
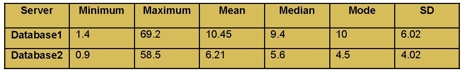
Figure 4 shows the results from the database nodes during the test.
User Applications Services (UAS) Nodes
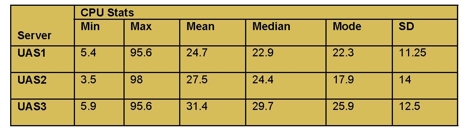
CPU utilization on the UAS nodes averaged 24.7 to 31.4% across the three nodes for the duration of the test. This shows that 3 UAS nodes can readily support an n-1 sparing strategy for half a million users. Spikes in CPU utilization above 90% were observed on all three machines during the first minute of the test. These were attributable to establishing database connections and building caches.
|
Conclusion
Performance
Ninety-five percent of responses occurred with less than 1 second of latency. This achieves the benchmarks set out in product specifications. It's also noteworthy that these results were achieved in a system modeled for real world traffic patterns.
|
|
Server Requirements
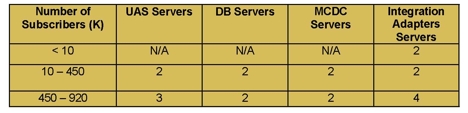
The service platform achieved cost-effective scalability-it supported close to 1 million subscribers with 11 servers as shown in the table to the right.
Resource Utilization & Service Continuity
The system easily accommodates heavy traffic loads in n+1 cluster configuration. The relatively low utilization also allowed ample headroom for service continuity in the event of a server failure.
Figure 5 shows the test results from the USA1, USA2 and USA3 servers.
Cost
Figure 6 shows a comparison between the number of subscribers and different servers.
|
Based on a full list price hardware purchase (servers/racks, switches), the 450K system would cost $.17/user; the 920K system, $0.11/user.
|
|
Espial is a leading provider of on-demand software to telco, cable and hospitality operators as well as to consumer electronics manufacturers. Espial's intelligent and open standards software is used across the world by cable operators (MSO), telco IPTV operators, hospitality operators and consumer electronic manufacturers. Its middleware, browser and video-on-demand solutions provide superior service delivery, advanced service innovation tools and the ability to serve a wide range of market segments - including over-the-top, IPTV, hybrid IP, multi-dwelling unit and enterprise.
200 Elgin St., Ste. 901
Ottawa, Ontario K2P 1L5, Canada
Tel: 613-230-4770
Fax: 613-230-8498
www.espial.com
|